You’ve probably heard about the recent crypto flash crash. It’s when prices drop really fast, and it can be a bit scary if you’re involved in trading or investing. We’re going to look at what caused this latest event and what it means for the market. It’s important to understand these crypto flash crash causes so you can be better prepared.
If you think flash crashes are scary, wait till you see what happened when whales started moving size — read Vitalik Buterin’s ETH Sales… Should US Traders Worry? (Binance/Coinbase ALERT for US & Canada traders before the next $1B shakeout).
Key Takeaways
- The crypto market is sensitive to big news, like trade wars, which can cause prices to fall quickly.
- Using too much borrowed money (leverage) in trading makes losses much bigger when prices drop.
- Even after a big drop, the crypto market can bounce back, showing it’s able to recover.
Understanding the Crypto Flash Crash Causes
When you look at what causes these sudden, sharp drops in crypto prices, often called flash crashes, a few key things pop up. It’s not usually just one single event, but a mix of factors that can snowball quickly.
Market Volatility and External Shocks
The crypto market is known for being jumpy. Prices can swing wildly based on news, rumors, or even just big trades. Think about it: a single large sell order, like one for around $67 million, can send a major coin like Bitcoin tumbling to a much lower price on certain exchanges. This kind of event shows how sensitive the market is to big players moving in or out.
Beyond just big trades, external events can really shake things up. Geopolitical news, like trade tensions between countries, can make investors nervous about all sorts of assets, including crypto. When people get worried, they tend to sell first and ask questions later, which is how a small worry can turn into a bigger price drop. It’s like a ripple effect; one wave of selling can trigger another.
- Sudden News Events: Unexpected announcements can cause immediate panic.
- Macroeconomic Shifts: Changes in the global economy influence investor sentiment.
- Large Order Execution: A single massive trade can destabilize prices.
The digital asset space, by its nature, reacts swiftly to both internal market dynamics and external global events, often amplifying the impact of any single trigger.
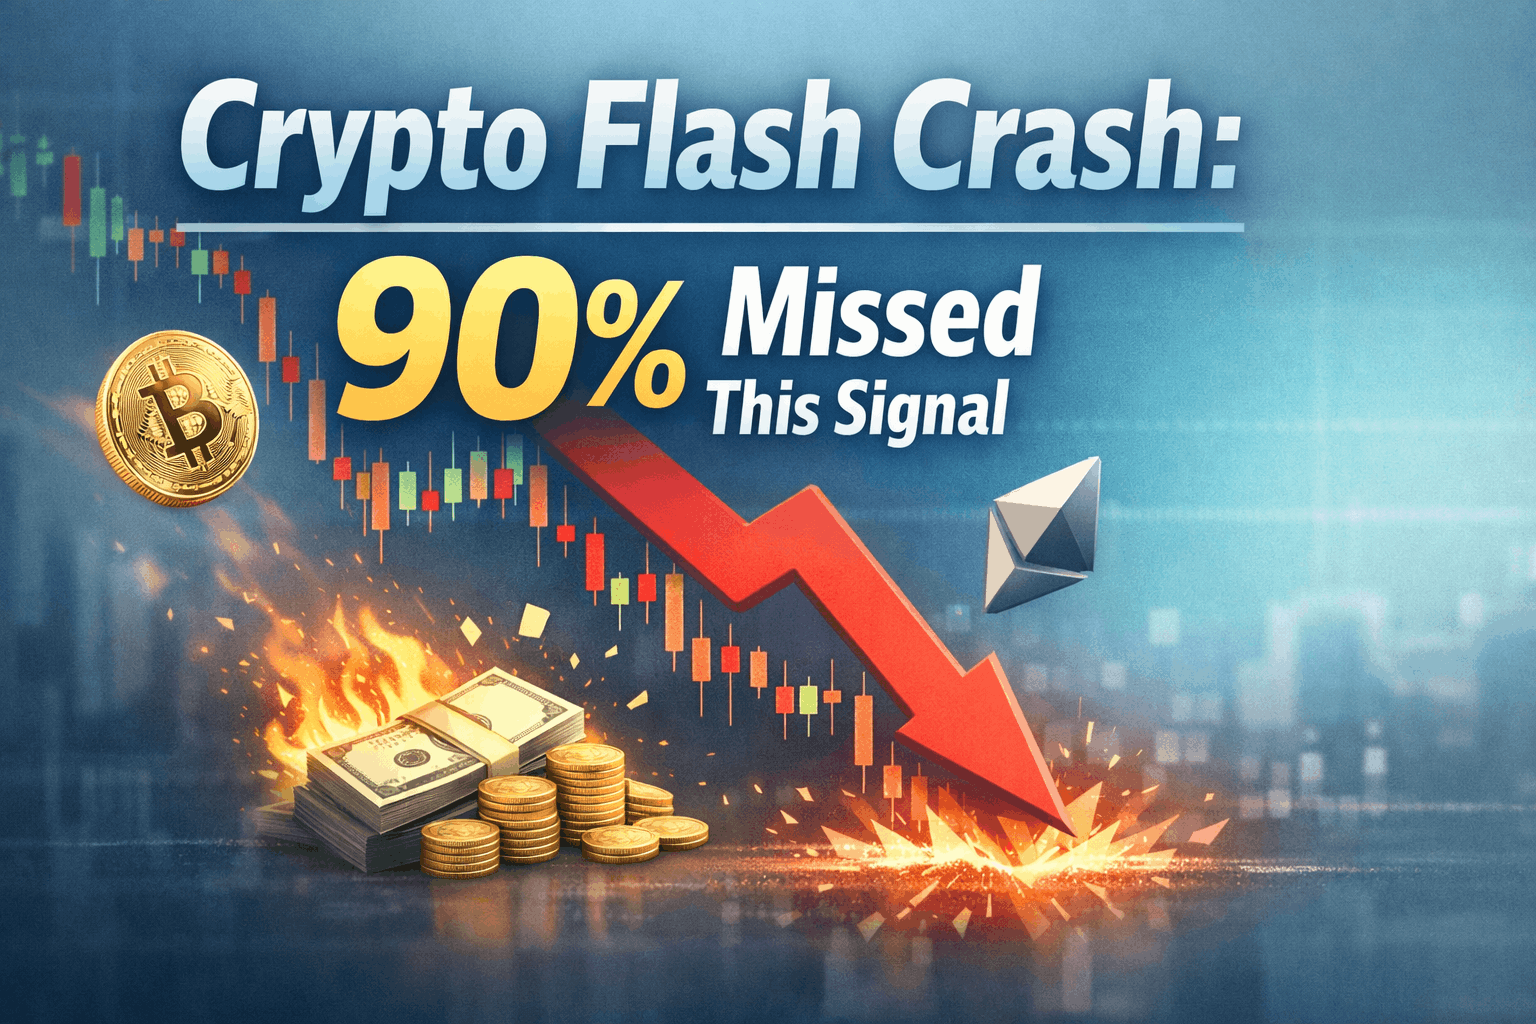
What Was the Signal That 90% of Traders Missed?
Not a divergence. Not a pattern. A structural condition that made a crash mathematically inevitable — and it was visible for 72 hours before the wick.
Two readings converged in the days before the drop:
Open interest hit a local extreme. BTC perpetual open interest was sitting at levels not seen since the last major flush. That number alone means nothing. What it means in context is that the market was maximally leveraged in one direction, with minimal room to absorb any selling pressure without triggering a chain reaction. High open interest is not a short signal. It is a fragility signal. The market doesn’t need to be wrong — it just needs to be shaken.
Funding rates confirmed the crowding. Perpetual funding was running consistently positive and elevated across Binance, Bybit, and OKX simultaneously. When funding is this skewed for this long, two things are true: longs are paying shorts to stay in the trade, and the pain trade is down. This is not a new pattern — CoinDesk documented the same open interest and funding rate extreme building weeks before the October 2025 liquidation cascade, which wiped $19 billion in a single event. Not because bears are right — but because the market structure itself punishes the overcrowded side. Every long added at elevated funding was adding fuel to the eventual flush.
The signal was not one indicator. It was the combination: maximum leverage, maximum crowding, and a macro environment primed for a shock. The moment a catalyst arrived — any catalyst — the liquidation engine had everything it needed to run.
If you were watching open interest and funding together and still held full leverage longs going into that week, the market didn’t surprise you. You ignored it.
How a $67M Sell Order Triggered a $1B Liquidation Cascade
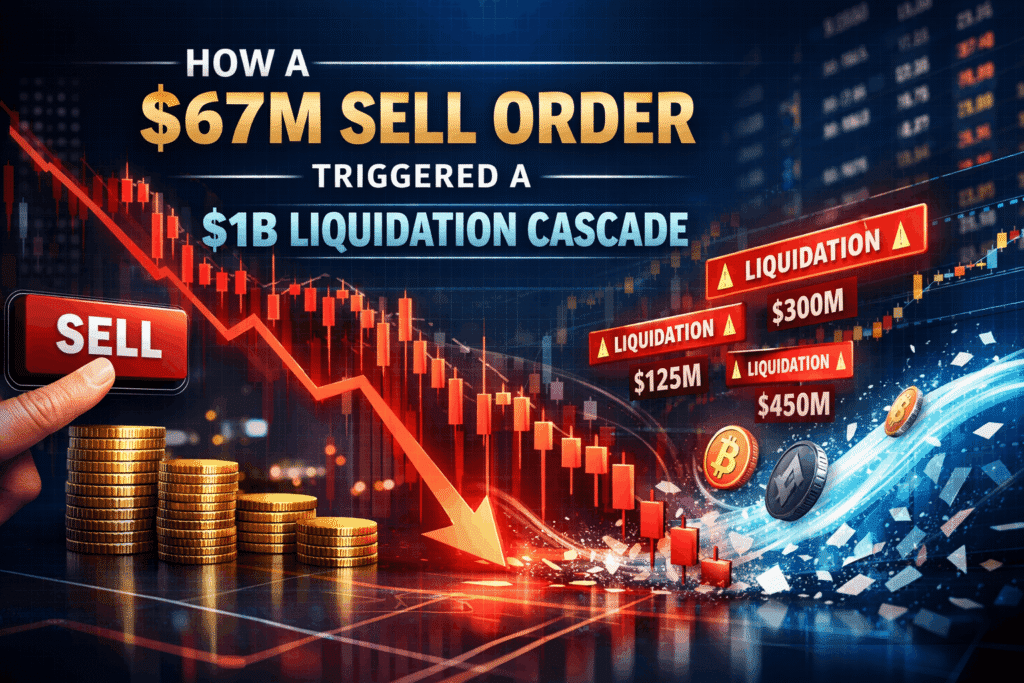
The $67M order didn’t cause $1B in liquidations. The positioning did. The order was just the match.
Here is the precise mechanics of how a single trade detonated an entire market:
The order hit a hollow book. Liquidity in crypto perpetuals is not uniform. During the Asia-to-Europe session handoff, order book depth thins out significantly — fewer market makers actively quoting, wider spreads, larger gaps between price levels. A $67M market sell into that environment doesn’t get absorbed evenly. It eats through multiple price levels, triggering a cascade of stop hunts and liquidation clusters that are visible on any decent heatmap tool before the fact.
The first wave of liquidations added direct sell pressure. Every long liquidated by the exchange becomes an immediate market sell. Not a limit order — a market order. In a thin book, a cluster of simultaneous market sells doesn’t just move price, it removes the bids that were supporting the next price level entirely. The book doesn’t refill fast enough. Price gaps.
The gap triggered the next cluster. Liquidation levels are not randomly distributed. They cluster at round numbers, at recent highs, and at leverage multiples of key price levels. As soon as one cluster was hit and price gapped through it, the next cluster was immediately in range. This is why the cascade accelerated rather than slowed — each liquidation brought the next one closer.
Cross-margin accounts amplified the speed. Traders running cross-margin had their entire account balance exposed. A position going underwater didn’t just liquidate that position — it began drawing down the full account, forcing the exchange to liquidate multiple positions simultaneously across multiple pairs. This is why altcoins with zero direct exposure to the initial BTC sell-off dropped 40% within the same window.
The recovery came from the same mechanism running in reverse. Once the liquidation clusters were cleared and the book was no longer being systematically hunted, spot buyers — many of them institutional — stepped in at technically significant levels. No fundamental change. The fuel for the crash was exhausted, and price snapped back to where the real market was.
Total damage: nearly $1 billion in 24 hours. Total time for the initial move: minutes. This is not a black swan. This is leverage clearing itself. It happens every cycle.
The Role of High Leverage in Amplifying Losses
Another big piece of the puzzle is leverage. Many traders use borrowed money to make bigger bets, hoping to increase their profits. This is common in crypto futures trading. While leverage can be great when prices are going up, it’s a double-edged sword. If the market moves even a little bit against your position, you can lose everything very quickly.
When prices start to fall, these leveraged positions can get “liquidated.” This means the exchange automatically closes your trade to stop you from losing more money than you put in. But here’s the kicker: all these forced sales add even more selling pressure to the market. So, a small price drop can trigger a wave of liquidations, which pushes prices down further, causing even more liquidations.
Impact and Aftermath of the Crypto Flash Crash

Significant Financial Losses and Increased Volatility
When a crypto flash crash happens, it doesn’t just shake you up—it can wipe out huge sums almost instantly. You probably noticed accounts online talking about billions of dollars in liquidations in under a day. If you had open leveraged positions, you might have found them force-closed, especially if the market took a sharp turn. Bitcoin, Ethereum, and especially the smaller altcoins, saw prices fall hard—sometimes over 40% in minutes. You may have also noticed:
- Wild price swings across the board, not just for major coins.
- Smaller exchanges sometimes suffered outages or slow trades.
- Panic selling pushed volatility even higher, forcing more liquidations.
It’s clear that high leverage and market panic make these flash crashes even more intense and can drag almost every account—no matter how seasoned—down with them.
Market Resilience and Recovery Patterns
It’s not all bad news, though. After the dust settles, crypto markets have shown they can bounce back fast, especially when outside fears start to fade. You could see the weekend after the crash as proof—the headlines were grim, but by Monday, Bitcoin and Ethereum prices were already climbing.
Most recoveries look something like this:
- Steep fall, often followed by quick but choppy rebounds.
- Traders who survived take smaller and less risky positions.
- Market sentiment settles, often on the back of reassuring news or cooling tensions.
- New flows from big investors help support prices again.
Institutional investors can make a big difference here. Even during crashes, money kept moving into Bitcoin and Ethereum ETFs. On top of that, stronger technical support levels, like Bitcoin’s 200-Day EMA, can help slow down panicked sellers.
In the end, market resilience is shaped by how quickly traders adjust after liquidation storms, and it shows just how tough—even if chaotic—these markets can be.
What the Bitcoin 200-Day EMA Tells You Before a Crash
Most traders use the 200-Day EMA wrong. They treat it as a support level. It is not a support level. It is a positioning level — and the distinction matters enormously in how you trade around it.
Here is what the 200-Day EMA actually represents: the average cost basis of every participant who entered in the last 200 days, weighted toward recency. When price is above it, the majority of recent participants are in profit. They hold. When price approaches it from above, those same participants face the psychological and mechanical threshold of break-even — some sell, most hold and watch.
What makes it significant during flash crashes specifically is institutional behaviour. Large allocators — hedge funds, ETF managers, treasury desks — have the 200-Day EMA coded into their systematic buying rules. Not because it’s magic. Because enough of them use it that it becomes self-fulfilling at scale. When BTC approached the 200-Day EMA during the March cascade, ETF inflows didn’t stop. They accelerated. The level acted as a trigger for pre-programmed accumulation, not because the buyers were reacting emotionally, but because their mandate told them to buy at that level.
The pre-crash reading that mattered: In the days before the flash crash, BTC was trading comfortably above the 200-Day EMA but had been making lower highs on the daily. Price above the 200 with a weakening structure above it is not a bull signal — it is a stretched rubber band. The further price extends above the 200 in a low-volume, high-leverage environment, the more violent the snap back to it tends to be.
The post-crash confirmation: When BTC bounced off the 200-Day EMA and closed a daily candle above it, that was the only confirmation that mattered. This is not a one-cycle observation — CoinDesk confirmed in February 2026 that the 200-week moving average has marked the price bottom in every major Bitcoin bear market since 2015, making it one of the most structurally reliable levels in all of crypto. Not the news cycle, not the fear index, not Twitter sentiment. A daily close above the 200 after a liquidation event tells you the structural support held. That is the re-entry signal that traders watching this level acted on while everyone else was still processing the headlines.
3 Practical Risk Rules for the Next Flash Crash
No frameworks. No theory. Three rules that change your exposure structurally before the next event.
Rule 1 — Your leverage limit is not set by your risk tolerance. It is set by the liquidation heatmap.
Before entering any leveraged position, pull the liquidation heatmap on Coinglass or Hyblock. Identify where the nearest liquidation cluster sits below your entry. If a move to that cluster would wipe your position, you are not trading — you are providing exit liquidity for whoever triggers that cluster. Size your position so that the nearest major liquidation cluster below current price is survivable. If you can’t survive the flush of that cluster, your position is structurally wrong regardless of your directional thesis.
Rule 2 — When funding has been positive for more than 5 consecutive days, cut leverage in half. No exceptions.
This is not a prediction rule. It is a structural rule. You are not predicting a crash when funding is elevated — you are acknowledging that you are in the most crowded, most fragile position in the market. Being right about direction and losing money because of a liquidation cascade is not bad luck. It is bad positioning. Five consecutive days of elevated positive funding is your automatic deleveraging trigger. Half the position size, same thesis, you survive the flush and reload at better prices.
Rule 3 — Define your invalidation level in dollar terms before the trade opens, not in percentage terms.
“I’ll cut if it drops 15%” is not a risk rule. It is a prayer. Your invalidation level is the specific price at which the reason you entered the trade is structurally broken — the level where your thesis is wrong, not just temporarily uncomfortable. Write it down before you open the position. During a flash crash, price moves faster than your ability to think clearly. The traders who performed best during the March event either had pre-set liquidation levels they never second-guessed, or had already sized out of leverage based on the structural warnings described above. The traders who blew up were making real-time decisions in a market moving 10% per minute. You cannot think faster than a liquidation cascade. Your rules can.
FAQ
What is a crypto flash crash?
Why do flash crashes trigger huge liquidations?
When the price drops fast, exchanges automatically close (liquidate) leveraged long positions to prevent losses. This forced selling adds more downward pressure, creating a feedback loop that wipes out billions quickly